- 首页
- > GRE数学竟然还会考甘特图!!!
GRE数学竟然还会考甘特图!!!
2021-06-22 20:16:42
1 喜欢 | 2649 阅读
最近GRE数学怪题偏题频频出现,冷门的考点开始逐渐加入到考试中来,难倒了不少杀G同仁。比如今天要讲的“甘!特!图! ”有些同学看到这几个字就会问,甘特什么?甘什么图?什么特图?
没关系,我们一起跟这个甘特图过过招!先来看看下面这几道题:
Questions 4 to 6 are based on the following data.
Each of the15 customers who arrived at a customer service desk between 9 AM and 10 AM was served in order of arrival by one of the two customer service representatives. Each representative served one customer at a time and finished with that customer before serving any other customers. The graph shows the waiting and service times, recorded to the nearest minute, for customers numbered 1 to 15.
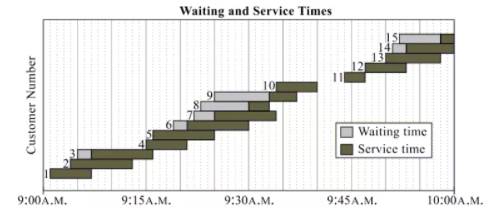
Of customers 4, 6, 8, 9 and 10, which one was served by the customer service representative who served customer 1?
A. Customer 4
B. Customer 6
C. Customer 8
D. Customer 9
E. Customer 10
According to the recorded times, which customer had the greatest ratio of waiting time to service time?
A. Customer 6
B. Customer 7
C. Customer 8
D. Customer 9
E. Customer 15
What was the range of the recorded service times, in minutes, for the 15 customers?
A. 4
B. 6
C. 7
D. 9
E. 14
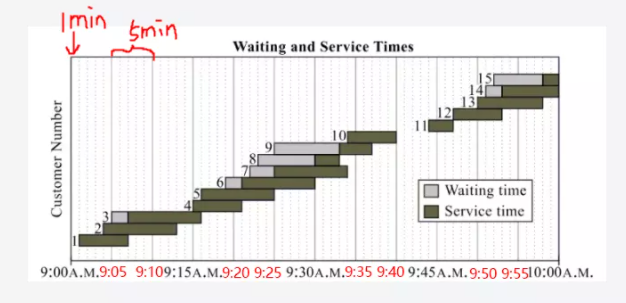
问服务了第一个客户的客户代表,又服务了下面哪一位客户。
假设服务了第一个客户的客户代表是甲,我们又已知他服务完这个客户才能服务下一个客户。那我们就可以来快乐地数格子就行了。1号服务完了之后,刚好3开始了,就说明甲服务的第二个客户是3号,3结束了之后是5开始,5结束了之后是7开始,7结束了之后是10开始。所以被甲服务的客户就是3、5、7、10这几个。那么答案就选E。So easy!
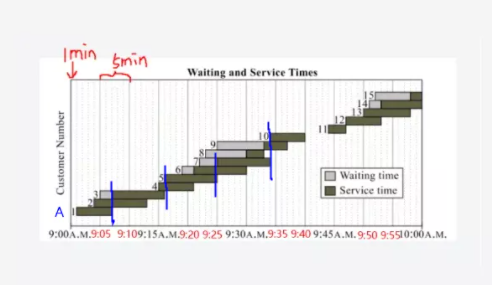
问的是,哪个客户,等待时间:被服务时间的比率最大。
我们回到图上,等待时间是灰色的部分,被服务时间是红色的部分。比率最大,那我们就找灰色最长红色最短那个人就可以了。看图会发现,灰色部分比红色多的,基本上就是8、9、15这三个人,那我们就把范围给缩小了。分别写出来他们的等待时间:被服务时间的比率来比较大小就可以了。
8号,等待时间占了7个小的竖格,那就是7 minutes,被服务时间占了3个小的竖格,那就是3 minutes,所以等待时间:被服务时间的比率=7:3=2.3333...
同理,9号等待时间:被服务时间的比率=8:4=2
15号等待时间:被服务时间的比率=6:2=3
很明显15号是等待时间:被服务时间的比率最大的那个。所以这道题选E。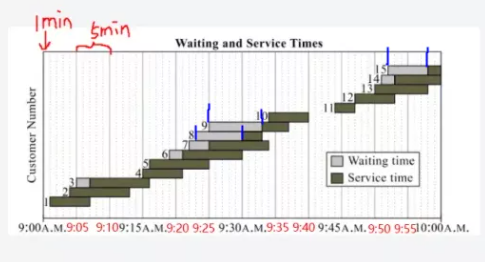
问的是15个客户的被服务时间里,极差是多少?
极差=最大值-最小值。
那我们还是回到图上,去找红色最长的和最短的就可以了。
红色最长的是3号和7号,各自占了9个小的竖格,两个人都是9分钟。
红色最短的是15号,只占了2个小的竖格,那就是2分钟。
9-2=7,所以这道题选C。
快来KMF解锁更多新内容吧

